“The Moving City” shows outcomes from a research project, namely MoTo – Mobilità Toscana, funded by the Tuscan Region, aimed at developing innovative techniques and tools to augment knowledge on dynamics and evolution of real systems in contemporary cities with through a practical application: a survey of the dynamics of mobility in the metropolitan area of Central Tuscany.
“The Moving City” shows how Information and Communication Technologies (ICT) represent an opportunity for gathering information on the functioning of vast territorial systems through the processing of real-time data, and how they can be utilized in order to improve our ability to plan and manage urban systems, with the idea of opening a window to the smart city of the future.
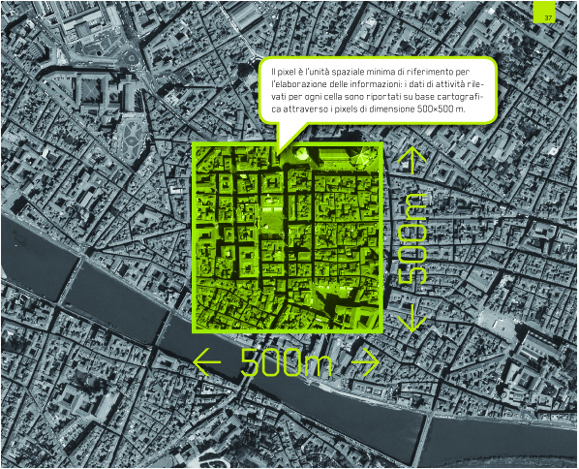
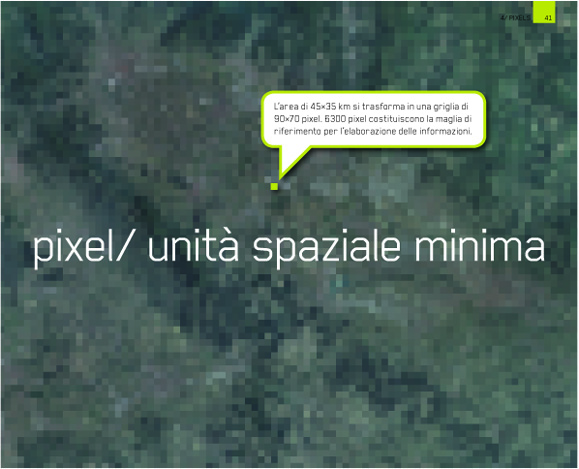
Representation of the spatial unit used in the Metropolitan Area of Florence.
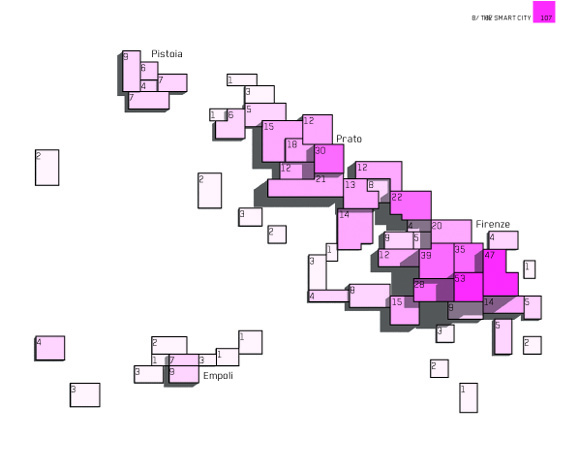
Metropolitan Area of Florence - Daily activity over 12 months – tot h24 avg working day
The activity of telephone traffic, that indirectly detects the population presence, has been processed starting with the values per pixel and expressed in classes of intensity through the chromatic scale, from yellow to red. In the dynamic sequence, the values express, in thousandths, the intensity of activity per spatial unit with respect to the overall activity in the entire area of study. Patterns and numbers allow the simultaneous reading of the results at both a qualitative and quantitative level.
Metropolitan Area of Florence - Hourly activity – h24 avg working day
This series of maps shows the sequence of activity detected for each hour of a typical workday. The chromatic scale corresponds to the intensity of activity. The maps of the sequence utilize the same value scale over 24 hours. In the dynamic sequence, the values reported per aggregate units indicate the relative weight (in thousandths) of each unit with respect to the entire area of study.dio.
Metropolitan Area of Florence - Variations in activity intensity per hourly intervals
The map shows the 09-10 and 18-19 variation of activity in a workday. The dimension of the pixel is proportionate to the variation in activity. The color grada- tion indicates, with red tones, an increase in activity, and with purple tones, a de- crease. The absence of color identifies the areas where activity remains stable or the variation is minimal.

Metropolitan Area of Florence – Synthetic scheme: intensity of daily activity – tot h24 avg working day
The map describes how the activity of the population that lives in the metropolitan area is actually distributed in space. The three-dimensional effect and the chromatic scale visually demonstrate the weight of each unit, measured in thousands, com- pared to the overall activity registered in the entire metropolitan area.